Script debugger: Difference between revisions
m (Protected "Script debugger" ([Edit=⧼protect-level-larianeditonly⧽] (indefinite) [Move=⧼protect-level-larianeditonly⧽] (indefinite))) |
m (Link script editor and behaviour script pages, add behaviour scripts category) |
||
| Line 1: | Line 1: | ||
<h1><u>The interface</u></h1> | <h1><u>The interface</u></h1> | ||
<p>The script debugger is part of the script editor | <p>The script debugger is part of the [[Script_editor|script editor]]. It can be used to debug [[Scripting|behaviour scripts]]. | ||
It has 3 main areas:</p> | |||
[[File:Interface script editor.png]] | [[File:Interface script editor.png]] | ||
<ol><li>Debug toolbar, with buttons and comboboxes for basic debug functions.</li> | <ol><li>Debug toolbar, with buttons and comboboxes for basic debug functions.</li> | ||
| Line 100: | Line 102: | ||
<h2>Script break</h2> | <h2>Script break</h2> | ||
<p>A script break will pause both the game and script. Right before the script is about to execute the line it will break (due to a breakpoint or a requested pause). After this script break nothing besides the script editor will update. This also means that there is no way to use other debug tools, like the console, during a script break. This is purely due to the nature of a debugger. If anything would be allowed to update during a script break it would invalidate the debug data and it would become unreliable.</p> | <p>A script break will pause both the game and script. Right before the script is about to execute the line it will break (due to a breakpoint or a requested pause). After this script break nothing besides the script editor will update. This also means that there is no way to use other debug tools, like the console, during a script break. This is purely due to the nature of a debugger. If anything would be allowed to update during a script break it would invalidate the debug data and it would become unreliable.</p> | ||
[[Category:Behaviour_Scripts]] | |||
Latest revision as of 21:07, 3 December 2017
The interface
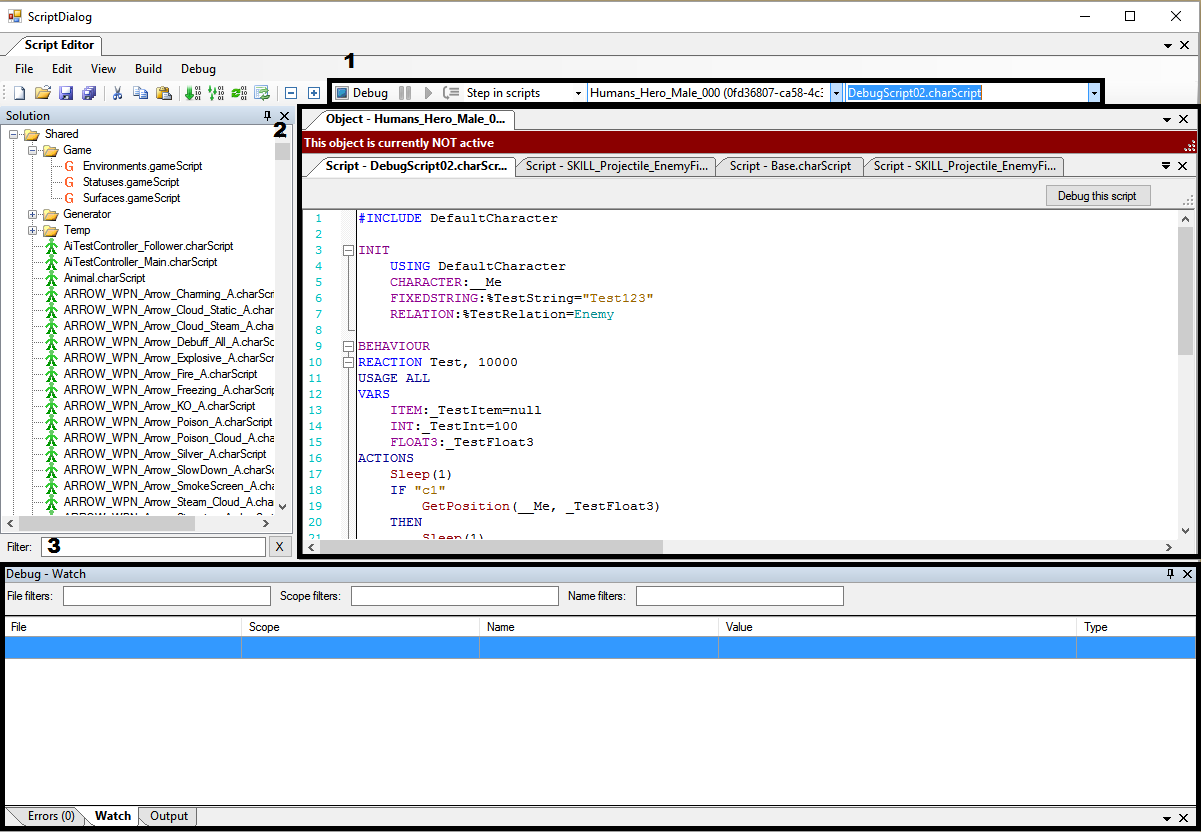
The script debugger is part of the script editor. It can be used to debug behaviour scripts. It has 3 main areas:
- Debug toolbar, with buttons and comboboxes for basic debug functions.
- An object panel, containing all the scripts of an object. The object panel is used to place breakpoints and to show the actual stepping.
- The debug panels: errors, watch, and output. Watch and output are only actuve when debugging is enabled. The watch panel provides info on script parameters during debugging, while the output panel shows the debug flow output and user output.
Debug toolbar
- Checkbox to enable/disable debugging features. Without this enabled no debug features will work, neither will the watch and output panel.
- [Alt+Pause] Pause button to pause the game as soon as possible. In practice it will break in the very first script of the frame.
- [F5] Continue button to continue the game when debugging.
- [F10] Step button to execute a 'step' when debugging. What this step is and in which script it will do this step is dependent on the following comboboxes (5, 6, and 7).
- A combobox to select the stepping type. 'Step in scripts' will step 1 action/condition forward in the script being debugged. 'Step in objects' will step 1 action/condition forward in the object being debugged. An object can have more than 1 script, meaning that a step might break in another script attached to the object.
- A combobox to select the debug object. All objects (whether item or character) with a script attached are available for selection. Whenever a step is made the object in this combobox is the object being stepped through. Selecting an object will open and show an object panel for the selected object.
- A combobox to select the debug script. The options are the scripts attached to the selected debug object. This combobox will be empty if no debug object is selected. Whenever a step is made the script in this combobox is the script being stepped through. Selecting a script will open and show an object panel for the selected object and show the selected script.
- Checkbox to enable/disable the following of the debug helper. When enabled the debugger will always open the object file for the currently selected object in the debug helper (activated with CTRL+SHIFT+LMB).
Object panel
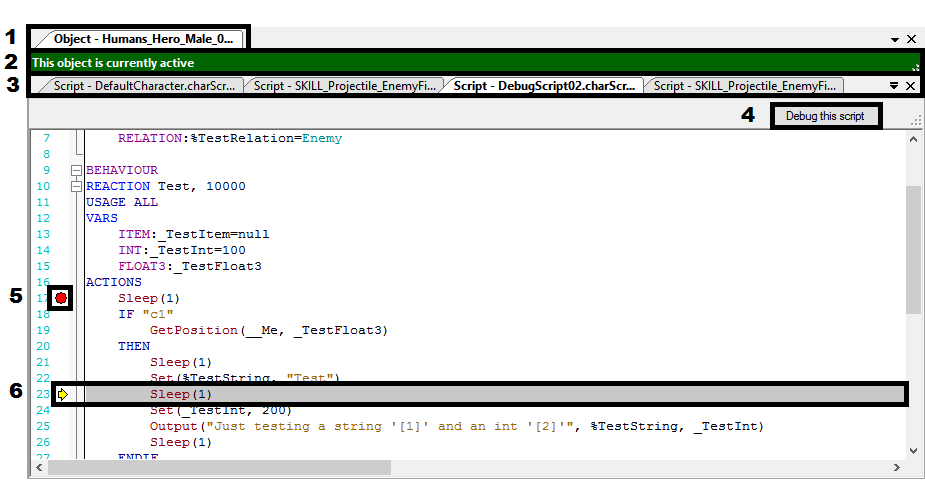
- An object panel tab name is always preceded by 'Object - ', while a script panel is preceded by 'Script - '.
- A green bar if the object is active (= executing scripts) or a red bar if the object is inactive.
- All scripts that are attached to the object have their own tab. All these panels are read-only and are only used for debugging.
- When clicking this button it will select the object and script of this panel in the comboboxes in the debug toolbar.
- A breakpoint that will 'break' (pause) the script whenever it is about to execute the line it has been placed on. Place a breakpoint by clicking in the margin next to the linenumbers and remove it by clicking the breakpoint again. If a breakpoint is disabled it will be white instead of red. If a breakpoint has conditions it will have a cross as well.
- The yellow arrow and grey background indicate the line that's about to be executed in the next step. These markers are only visible when debugging.
When a script is included in another script it's still attached to the object. This is not always as obvious due to recursive includes, so a blue bar will notify you in that case:
The breakpoint context menu can be accessed by CTRL+Click on a breakpoint:
It allows you to enable or disable the breakpoint (a disabled breakpoint will never break), access the breakpoint conditions menu, or to reset or view the hit count. The hit count of a breakpoint is the amount of times that line has been 'hit'/executed.
The breakpoint conditions menu can be accessed via the previously mentioned breakpoint context menu:
The menu is used to create conditional breakpoints: breakpoints that only break when all conditions pass. As can be seen there are two types:
- Hit count: set a condition for the hit count by checking whether the hit count is equal to, not equal to, larger than or equal to, smaller than, or a multiple of your entered hit count.
- Expression: set a condition by comparing the value of a parameter and check if it's equal to, not equal to, larger than or equal to, or smaller than your entered value. Checking whether a STRING is smaller than another STRING might not be best idea here. It would work for INT and FLOAT though.
The hover menu shows up when you're debugging and the mouse pointer hovers over a parameter for 0.5 or more seconds:
It's a quick way to see the value of a parameter, and it's not necessary to actually break to see the value.
Debug panels
All debug panels can be opened via the 'View'-dropdown in the menubar.
Watch panel
- Filters for the script paramaters based on the file, scope, and name. Multiple filters can be added if seperated by a space (e.g. "filter1 filter2").
- All script parameters of the object that is currently being debugged. The scope column contains 'Global' if the script parameter is not part of a reaction, interrupt, event, or scriptframe. The value column contains 'NULL' if the script parameter containts no data.
Output panel
- Clear the output panel of all output. This will not clear the saved output file.
- This part contains all output messages. It will automatically scroll to the last output message if the mouse pointer is located after the last message and no selection has been made.
It is possible to output text in the output panel with the Output() action:
EVENTS
EVENT ExampleEvent
ON
    OnTimer("ExampleTimer")
VARS
    FIXEDSTRING:_ExampleFixedString="ExampleFixedString"
ACTIONS
    Output("Example output with a fixed string '[1]' and an int [2]", _ExampleFixedString, INT:10)
The script event above would output the following text:
01:23:45.678: [CurrentDebugObject | CurrentDebugScript.charScript | 10]: Example output with a fixed string 'ExampleFixedString' and an int 10
As you can see, most output is preceded by some extra info on the location of the output (if relevant).
Debugging
Before you start debugging there are a few more things you need to know.
Starting and stopping a debug session
Starting and stopping a debug session can be done in both editor and game mode. To start or stop a debug session all you need to do is to enable 'Debug' in the debug toolbar. Starting a debug session will not change the behavior of the game, but you will start seeing output in the output panel if there is any. The watch panel will not contain any data until you break in a script by pausing or due to a breakpoint. The pause button and breakpoints will start working when you start a debug session as well.
Stepping through an object or script
Once you've got a debug session running you can start to actually debug a script. You can do this by putting a breakpoint on the line where you would like to pause the script. When that line is about to be executed the script will pause. When the script is paused you can step with the 'step' button. This will execute the current line and then break on the next line. The next line could be in a different script in the same object. The next script break location depends on your step setting (in the combobox). When the script is paused it is possible to change the current debug object and/or script in the comboboxes in the debug toolbar. This will cause the next step to break the script in the newly selected object and script.
Breakpoints
Breakpoints do not only have a line location, but an object and script location as well. Multiple objects can have the same script, but when you place a breakpoint it will count for only one of those. The actual breakpoint location is dependent on the object panel you used when placing the breakpoint. Also, not all locations are valid breakpoint locations. The only valid locations are lines that can be executed (i.e. actions, conditions, 'IF', and 'ELSE'). In the following code snippit the only valid line would be the last one:
EVENTS
EVENT Init
ON
    OnInit()
ACTIONS
    Output("OutputText")
Script break
A script break will pause both the game and script. Right before the script is about to execute the line it will break (due to a breakpoint or a requested pause). After this script break nothing besides the script editor will update. This also means that there is no way to use other debug tools, like the console, during a script break. This is purely due to the nature of a debugger. If anything would be allowed to update during a script break it would invalidate the debug data and it would become unreliable.


